
I published this post some years ago (archived version), but for unilateral decision of the online publisher, it is deleted, so I decide to recover it.

In the same year, a group of italian astronomers published a review of the models used in astronomy and examined some data used by AstroNeural collaboration. Finally in 2004 a collaboration between researchers in Italy, Germany and France perform an application of NNs to redshift calculations(3).
Now you can quest: What is a neural network?
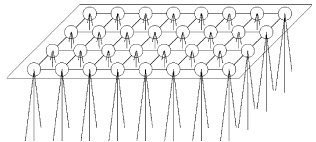
Simply is a system of node and link. In the structure we can eventually distinguished between different layers, and every layers are fully connected. Such networks are usually called Multilayer Perceptron NN, and the interaction between every node is modelled by the following funcition \[f(x) = k \sum_i w_i g_i(x)\] where $k$ is some predefined function, $g_i$ is a vector of functions.
A more simple model is \[n_j = h \sum_i w_{ij} z_i\] where $n_j$ is the $j$-th node, $h$ is a constant, $w_{ij}$ the weights of the link, $z_i$ the previous node.
There is also the self-organizing maps, in which every node, or neurons, are in competition with each other:
For example, we can see the plots in Vanzella's et al. paper(3). In the work, astronomers used a Multilayer Perceptron NN, using real data from Hubble Deep Field North dataset.
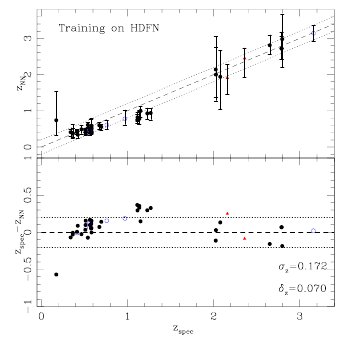
spectroscopic redshift in the HDF-S and the neural redshift using the colors as an input pattern. The training has been done on the HDF-N spectroscopic sample, the estimation of the redshift for each object is the median of 100 predictions and the error bars represent 1- interval. Open circles represent objects with unreliable photometry and triangles are objects with uncertain spectroscopic redshift.
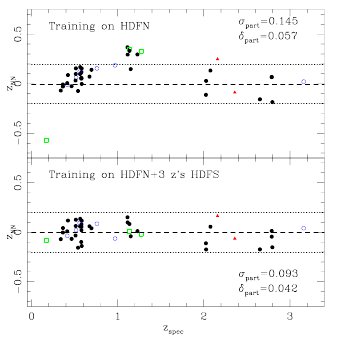
One of the most important tool in NNs is the ability of these type of networks to learn from data.
The last plot that I propose you is the redshift distribution of the spectroscopic sample:

Enjoy!
(1) Núñez J. & Llacer J. (2003). Astronomical image segmentation by self-organizing neural networks and wavelets, Neural Networks, 16 (3-4) 411-417. DOI: 10.1016/S0893-6080(03)00011-X
(2) Tagliaferri R., Longo G., Milano L., Acernese F., Barone F., Ciaramella A., Rosa R.D., Donalek C., Eleuteri A., Raiconi G. & Sessa S. (2003). Neural neZtworks in astronomy, Neural Networks, 16 (3-4) 297-319. DOI: 10.1016/S0893-6080(03)00028-5 (pdf)
(3) Vanzella E., Cristiani S., Fontana A., Nonino M., Arnouts S., Giallongo E., Grazian A., Fasano G., Popesso P. & Saracco P. & (2004). Photometric redshifts with the Multilayer Perceptron Neural Network: Application to the HDF-S and SDSS, Astronomy and Astrophysics, 423 (2) 761-776. DOI: 10.1051/0004-6361:20040176 (arXiv)
No comments:
Post a Comment
Markup Key:
- <b>bold</b> = bold
- <i>italic</i> = italic
- <a href="http://www.fieldofscience.com/">FoS</a> = FoS